|
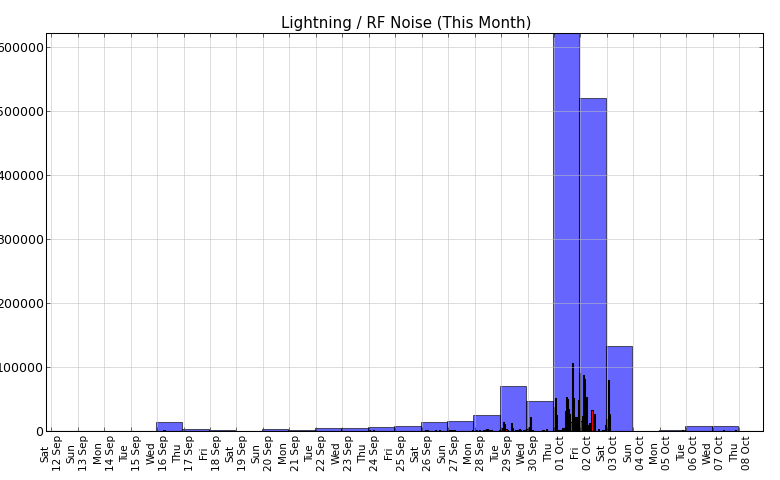
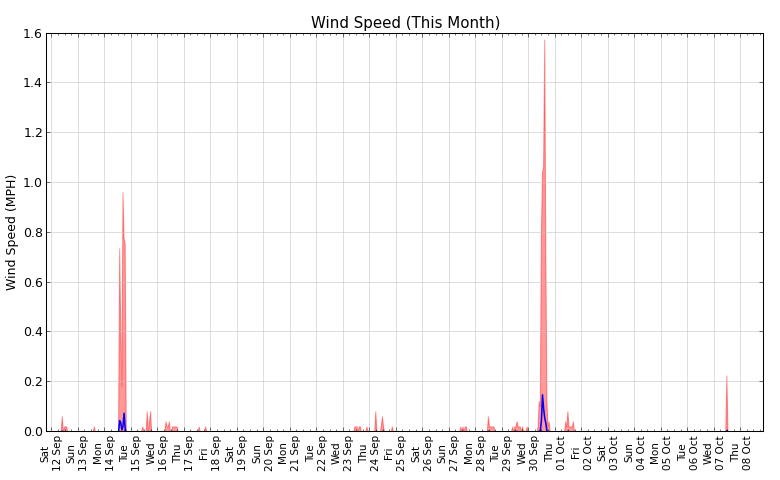
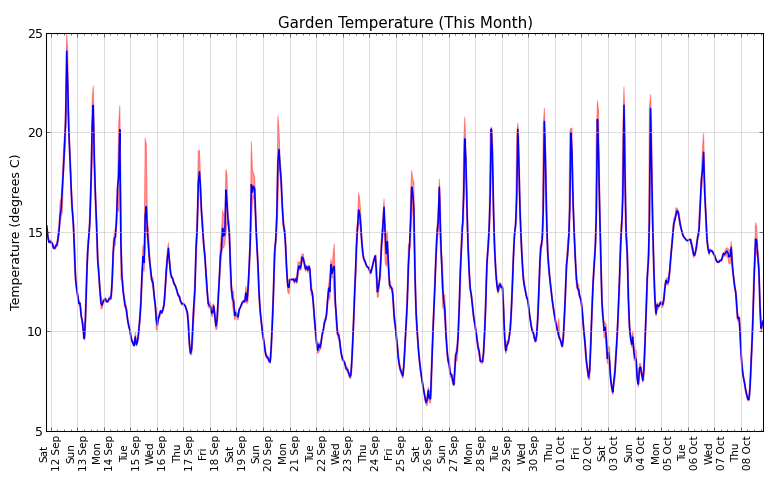
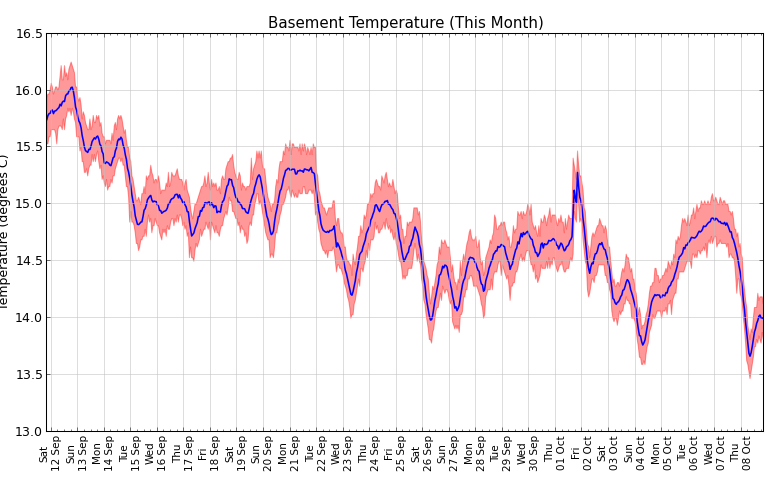
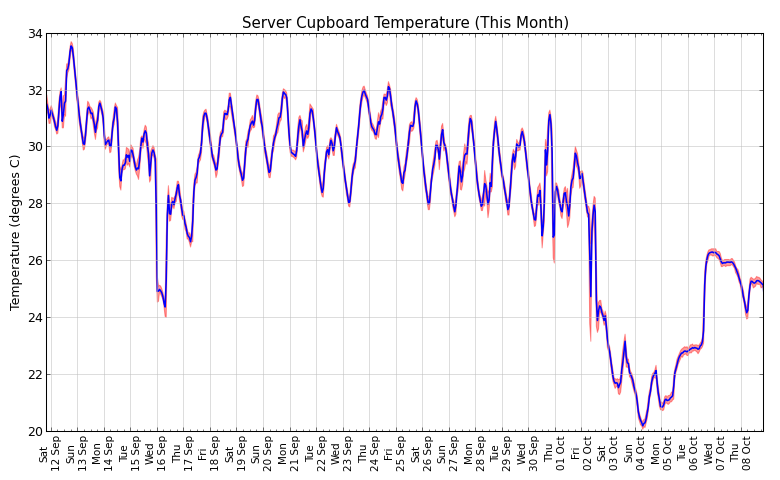
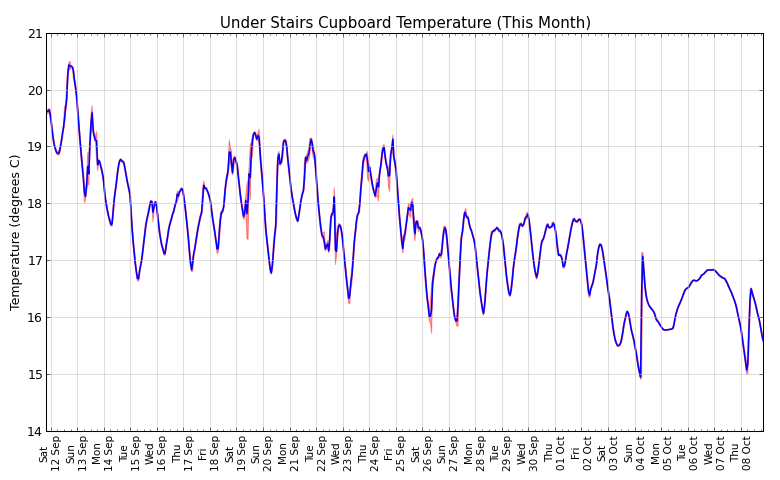
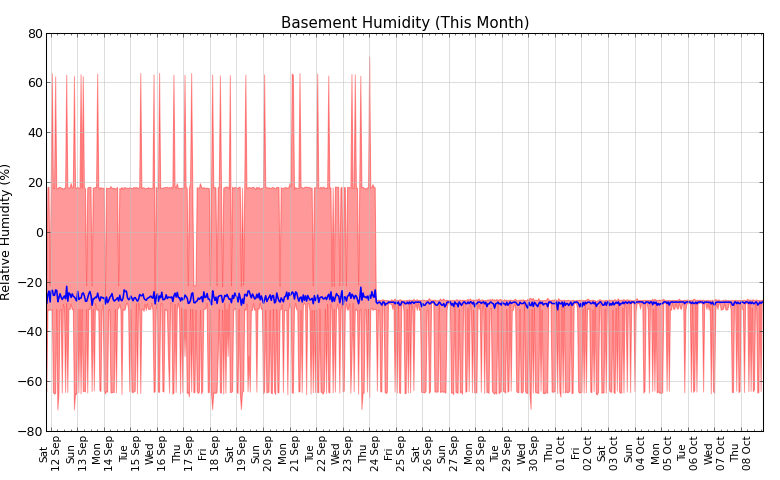
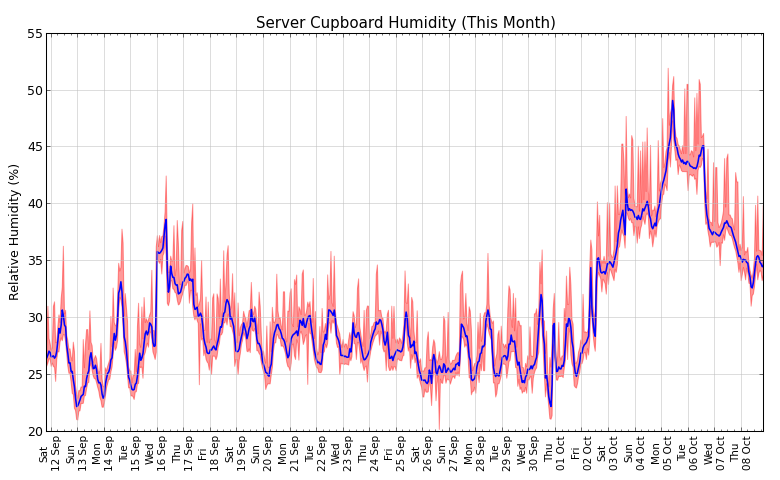
The Asmuns Hill Weather Station I've got some sensors on a serial bus that measure various environmental parameters. The serial bus uses the Dallas Semiconductor 1-Wire protocol. The bus hosts a single master (a PC with a USB to 1-Wire bridge, in this case) and several slave sensors, interconnected via a hub. "1-Wire" is a bit of a misnomer, since the bus in fact requires a minimum of two wires. One wire is a ground wire, while the second wire carries both power and data. 1-Pin would be a better name, because implementing the bus requires only one pin on a microcontroller (where pins are often in short supply). Many 1-Wire sensors are inexpensive and bus-powered, using a small capacitor to accumulate charge while the bus is idle and then using this stored energy to communicate with the bus master when polled. More complex sensors require a regulated 5V supply or unregulated 12V, both of which can be supplied along with the serial bus through a single Cat-5 cable. The power is injected into each branch of the serial network by the hub. Each sensor has a globally unique ID embedded in it at the factory. The bus master can thus address communication to an individual sensor. There is an enumeration process which enables the bus master to identify each individual sensor as it is added to the bus. A computer polls the sensors every minute and logs the data into a PostgreSQL database, using a modified version of Jonathan Hudson's w1retap software. I have also modied w1retap to support the AAG Wind Instrument. Most of the sensors are indoors at the moment. I intend to add additional sensors to monitor:
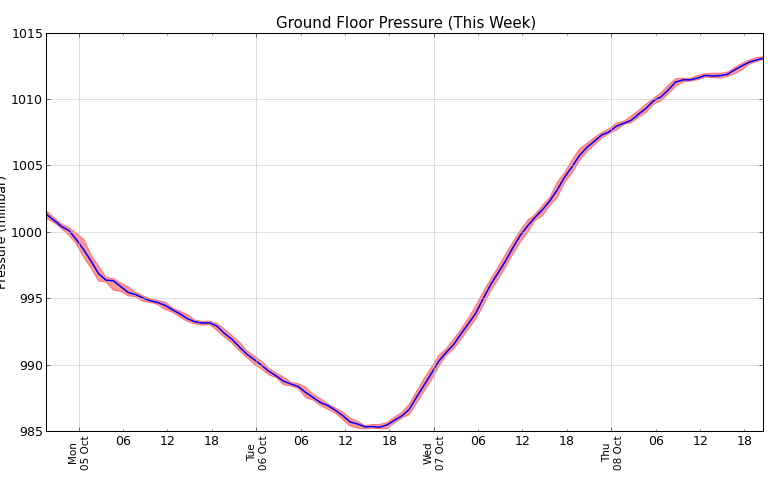
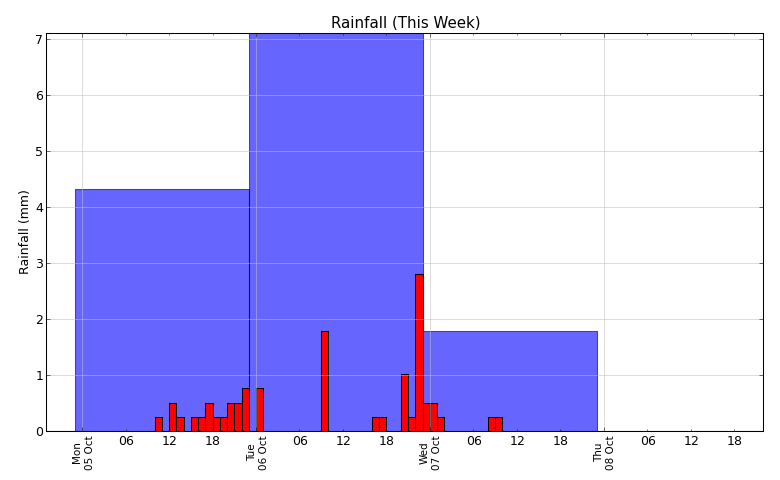
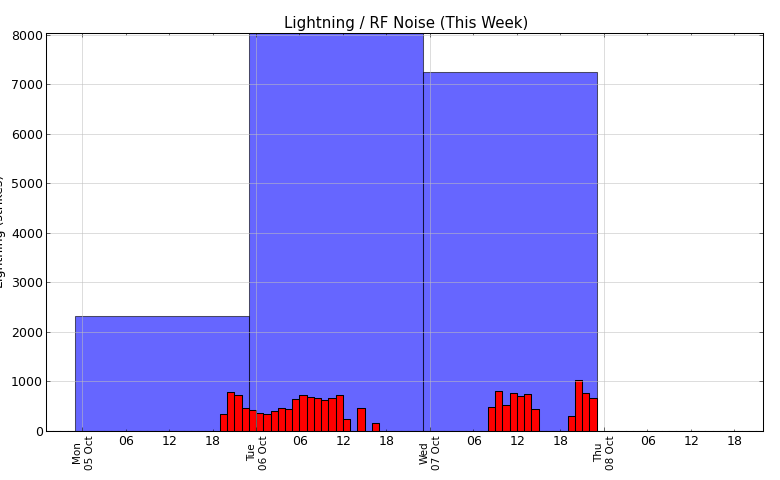
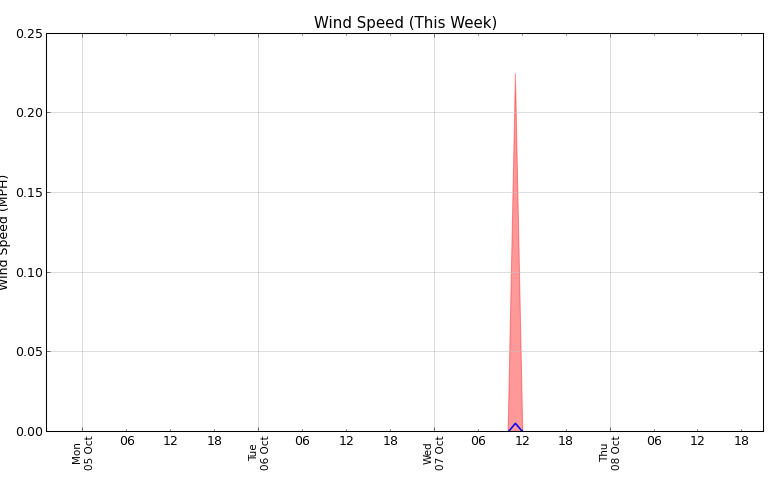
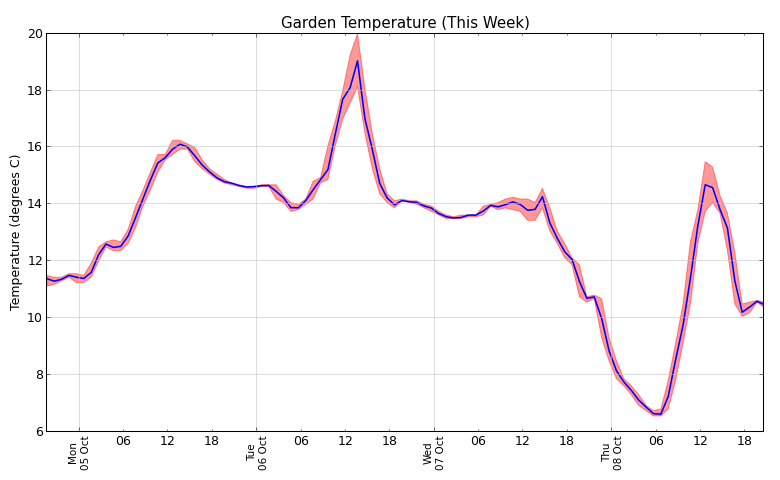
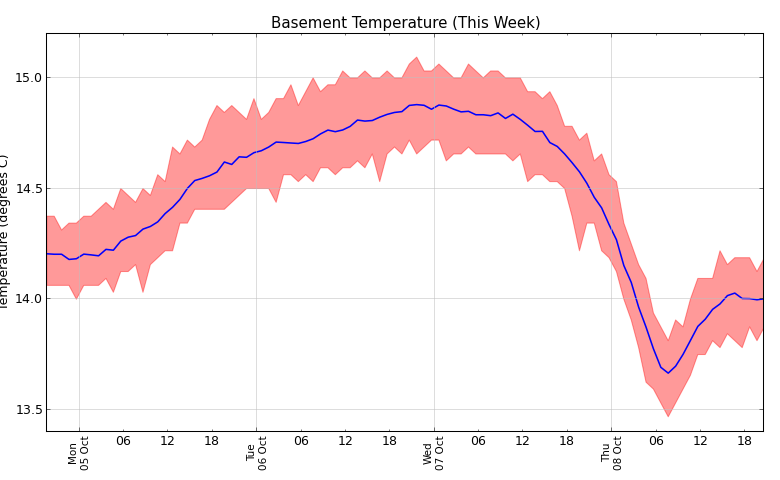
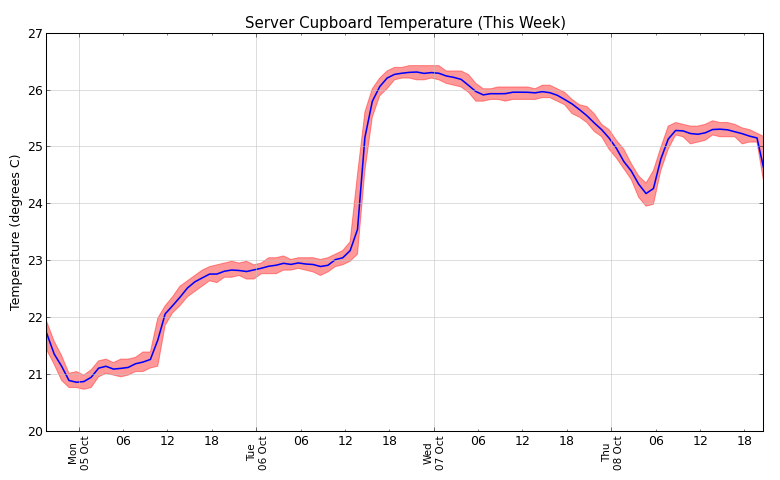
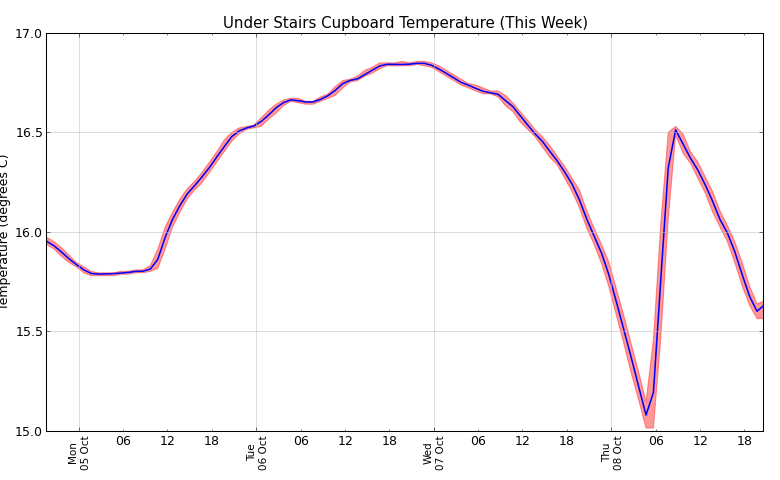
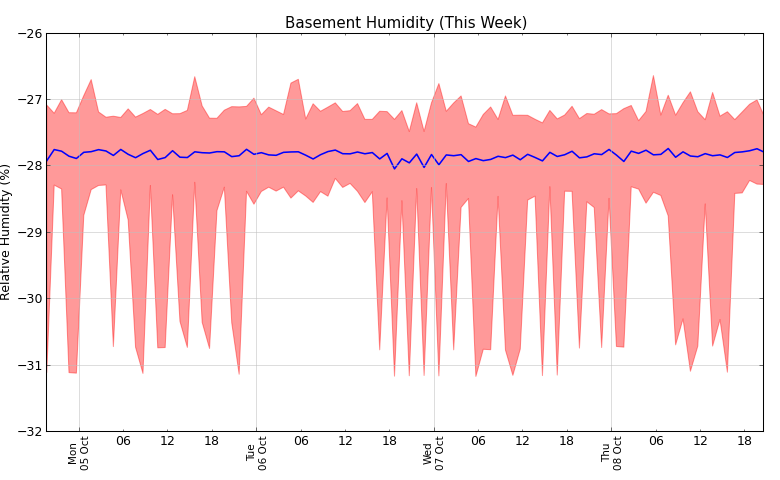
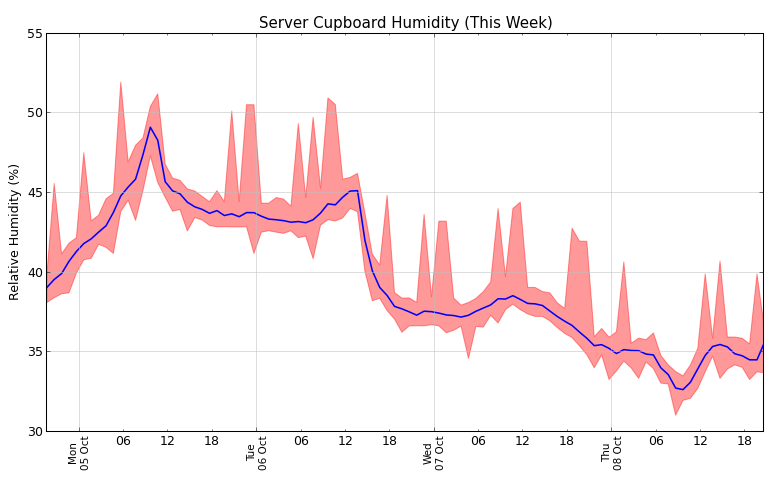
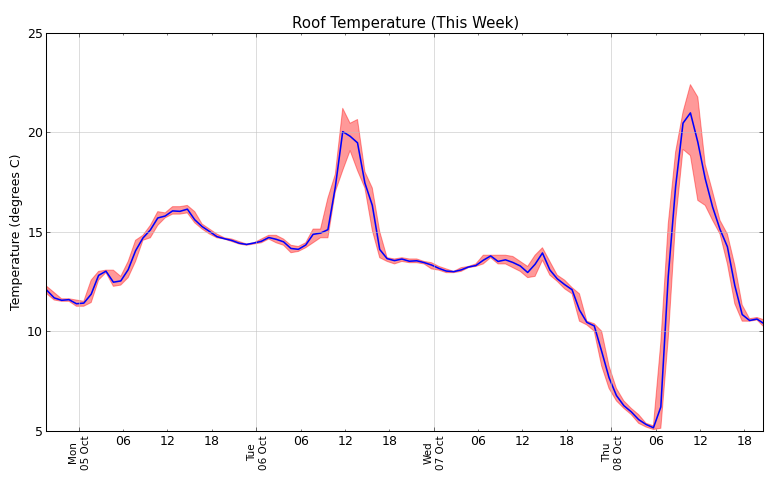
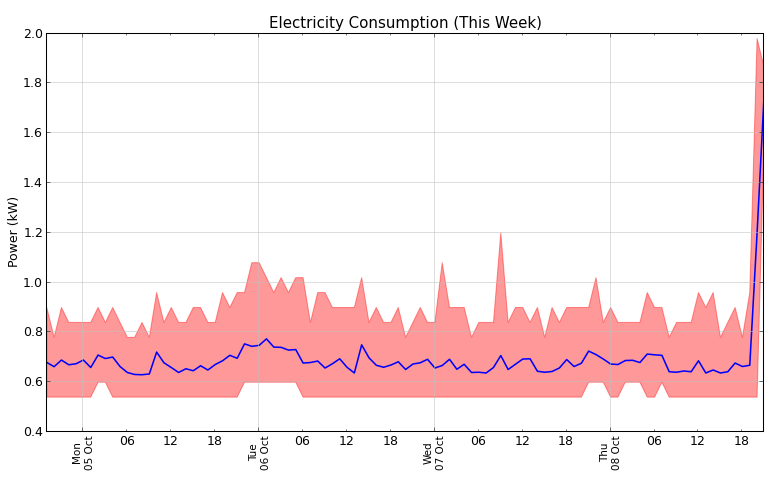
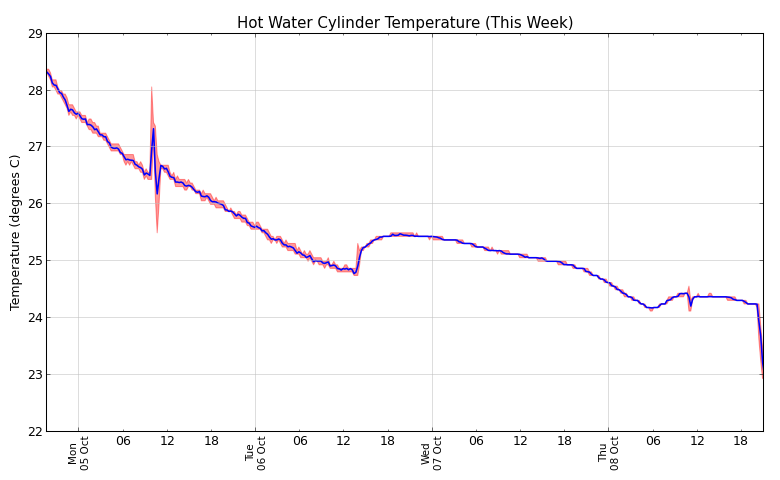
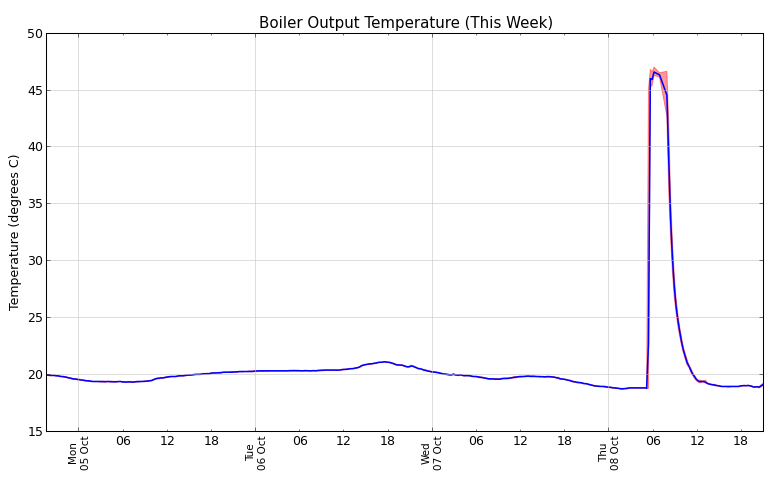
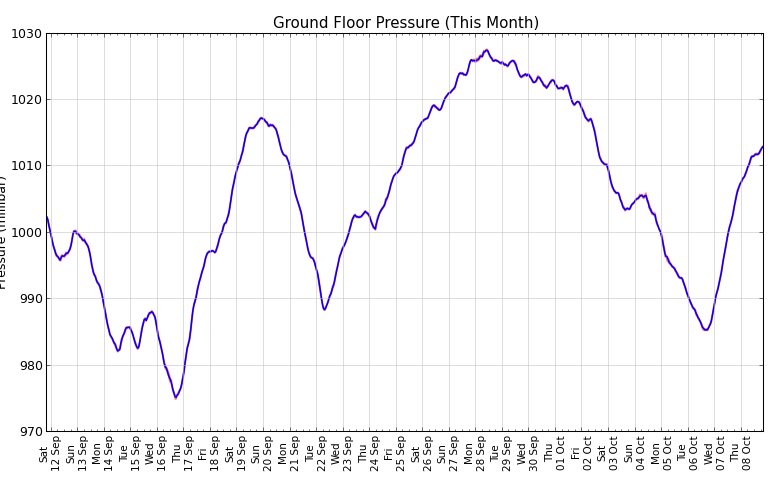
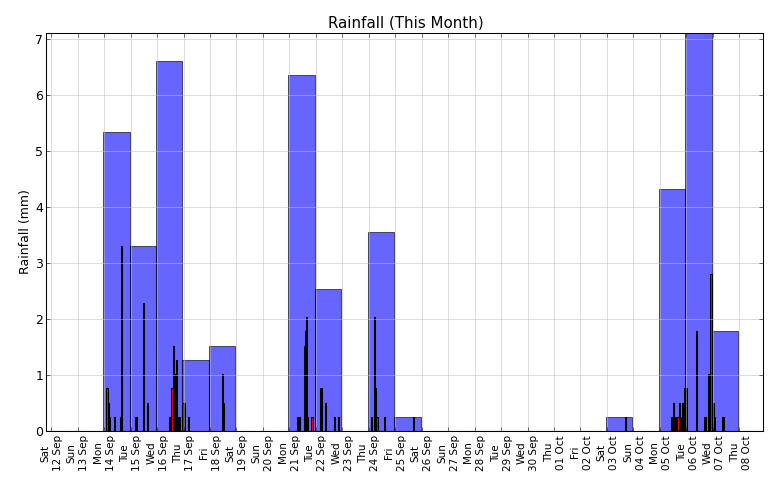
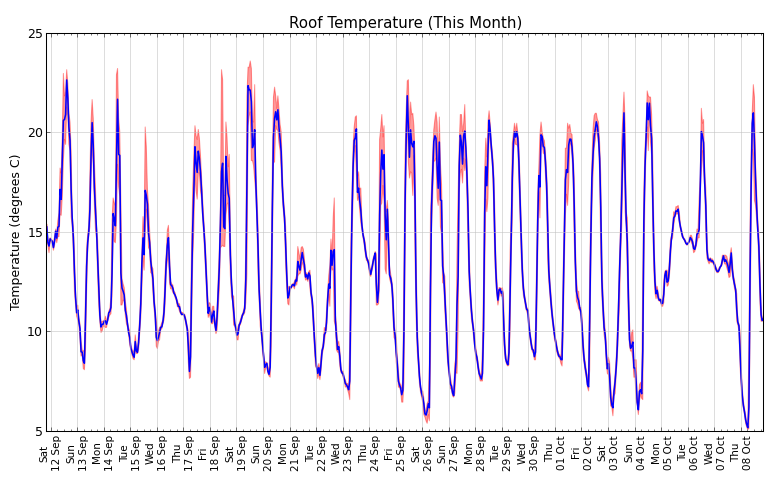
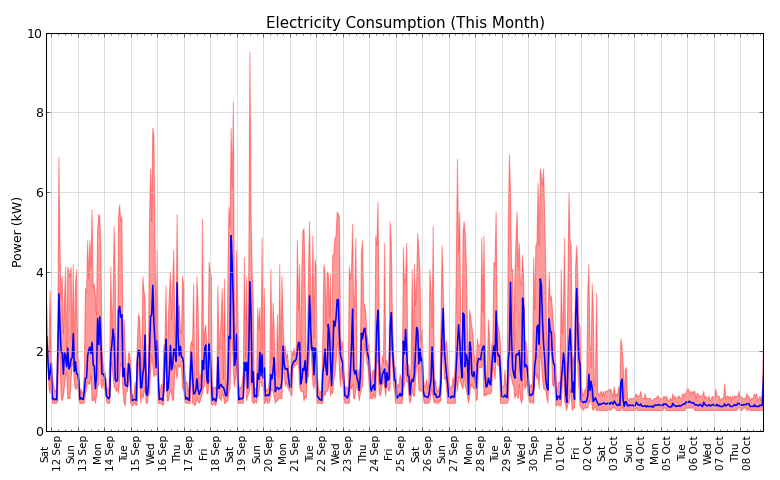
I wrote a Python script to analyse the sensor readings and plot pretty graphs using matplotlib. The sensors seem to be pretty reliable but about once a week at random they return completely mad readings (eg -700 millibar atmospheric pressure, which is physically impossible). Individual readings more than 6 standard deviations from the hourly arithmetic mean are therefore excluded (2007-10-01: this behaviour is currently disabled). The red area on the line graphs illustrates the range of the hourly minimum and maximum observed readings, while the blue line represents the arithmetic mean. These graphs are updated every half hour with live data. The rainfall graph is different; the red bars represent hourly rainfall, the blue bars represent total daily rainfall. Further details and photographs to follow... |